library(pmetar)
library(dplyr)
library(ggplot2)Package pmetar allows to download and parse current or historical METAR (Meteorological Terminal Aviation Routine Weather Report) reports, mainly for airports. A new version just landed on CRAN this month.
What is METAR - quoting Wikipedia
METAR is a format for reporting weather information. A METAR weather report is predominantly used by aircraft pilots, and by meteorologists, who use aggregated METAR information to assist in weather forecasting.
Raw METAR is highly standardized through the International Civil Aviation Organization (ICAO), which enables it to be understood throughout most of the world.
Examples
The format of METAR reports look complicated, however consist of information which can be interested not only for aircraft pilots. Below two examples of raw reports.
EPWA 301530Z 28011KT CAVOK 12/06 Q1006 NOSIG
KJFK 301451Z 08010KT 10SM OVC006 08/06 A3017 RMK AO2 SLP217 T00780056 58006 $
Firs steps with pmetar
Let’s load the necessary packages
Airports and current METAR reports
Now we can download our first current METAR reports. First we need to know the four letter ICAO airport code. Or better just take one from your our boarding passes and find the three letter IATA airport code.
Warsaw airport ICAO code is EPWA:
metar_get("EPWA")Getting airport informaiton from the file downloaded fromhttp://ourairports.com/data/airports.csvGetting information from Aviation Weather Center aviationweather.gov/data/metar/Don't use for flight planning or navigation![1] "EPWA 301830Z 33006KT 9999 -RA FEW030 BKN043 09/06 Q1007 NOSIG"Athens airport IATA code is ATH:
metar_get("ATH")Getting airport informaiton from the file downloaded fromhttp://ourairports.com/data/airports.csvGetting information from Aviation Weather Center aviationweather.gov/data/metar/Don't use for flight planning or navigation![1] "LGAV 301820Z VRB02KT 9999 FEW020 13/09 Q1007 NOSIG"We downloaded two current reports, strings, which can be decoded now. I will download them once again and assign them to two variables.
warsaw <- metar_get("EPWA")Getting airport informaiton from the file downloaded fromhttp://ourairports.com/data/airports.csvGetting information from Aviation Weather Center aviationweather.gov/data/metar/Don't use for flight planning or navigation!athens <- metar_get("ATH")Getting airport informaiton from the file downloaded fromhttp://ourairports.com/data/airports.csvGetting information from Aviation Weather Center aviationweather.gov/data/metar/Don't use for flight planning or navigation!athens[1] "LGAV 301820Z VRB02KT 9999 FEW020 13/09 Q1007 NOSIG"Decoding
Warsaw Airport:
warsaw[1] "EPWA 301830Z 33006KT 9999 -RA FEW030 BKN043 09/06 Q1007 NOSIG"metar_print(warsaw)Getting airport informaiton from the file downloaded fromhttps://ourairports.com/data/created by David MegginsonDecoded METAR report
--------------------
Remarks : Don't use for flight planning or navigation!
Airport ICAO code : EPWA
METAR date : NA
Day of month : 30
Hour : 18:30
Time zone : Z
Wind speed : 3.09 m/s
Gust : NA
Wind shear : NA
Wind direction : 330
Temperature : 9 °C
Dew point : 6 °C
Pressure : 1007 hPa
Visibility : 9999 m
Cloud coverage : Few (1-2 oktas) at 3000 ft (914.4 m); Broken (5-7 oktas) at 4300 ft (1310.64 m)
Weather information: Light intensity: Rain
Runway visibility :
Airport name : Warsaw Chopin Airport
Airport IATA code : WAW
Longitude : 20.9671 °
Latitude : 52.1657 °
Elevation : 110.3 m
Decode date : 2025-03-30 20:36:07.278308
Original METAR : EPWA 301830Z 33006KT 9999 -RA FEW030 BKN043 09/06 Q1007 NOSIG Athens Airport:
athens[1] "LGAV 301820Z VRB02KT 9999 FEW020 13/09 Q1007 NOSIG"metar_print(athens)Getting airport informaiton from the file downloaded fromhttps://ourairports.com/data/created by David MegginsonDecoded METAR report
--------------------
Remarks : Don't use for flight planning or navigation!
Airport ICAO code : LGAV
METAR date : NA
Day of month : 30
Hour : 18:20
Time zone : Z
Wind speed : 1.03 m/s
Gust : NA
Wind shear : NA
Wind direction : Variable
Temperature : 13 °C
Dew point : 9 °C
Pressure : 1007 hPa
Visibility : 9999 m
Cloud coverage : Few (1-2 oktas) at 2000 ft (609.6 m)
Weather information:
Runway visibility :
Airport name : Athens Eleftherios Venizelos International Airport
Airport IATA code : ATH
Longitude : 23.9445 °
Latitude : 37.9364 °
Elevation : 93.9 m
Decode date : 2025-03-30 20:36:07.314823
Original METAR : LGAV 301820Z VRB02KT 9999 FEW020 13/09 Q1007 NOSIG Certainly it is possible to extract each single parameter from METAR reports. If we are interested in a wind speed in knots at Athens, we use the other function.
metar_speed(athens, metric = FALSE)[1] 2Downloading historical METAR reports
Package pmetar allows to download historical METAR reports, with some limitations of course. Let’s assume we are interested in Tokyo Haneda Airport.
historical <- metar_get_historical(airport = "HND",
                                   start_date = "2025-03-01",
                                   end_date = "2025-03-29")
Getting airport informaiton from the file downloaded fromhttp://ourairports.com/data/airports.csvIowa Environmental Mesonet web page of Iowa State UniversityASOS-AWOS-METAR http://mesonet.agron.iastate.edu/AWOS/Don't use for flight planning or navigation!head(historical)[1] "202503010000 METAR RJTT 010000Z 10005KT CAVOK 11/03 Q1022 NOSIG RMK A3020"
[2] "202503010030 METAR RJTT 010030Z 08004KT CAVOK 11/04 Q1022 NOSIG RMK A3020"
[3] "202503010100 METAR RJTT 010100Z 08004KT CAVOK 11/04 Q1022 NOSIG RMK A3018"
[4] "202503010130 METAR RJTT 010130Z 08004KT CAVOK 12/04 Q1022 NOSIG RMK A3018"
[5] "202503010200 METAR RJTT 010200Z 08004KT CAVOK 12/05 Q1021 NOSIG RMK A3017"
[6] "202503010230 METAR RJTT 010230Z 08004KT CAVOK 13/06 Q1020 NOSIG" We can check the four letter ICAO airport code we see above to verify if we get data from the airport we want.
dplyr::glimpse(metar_location("RJTT"))Getting airport informaiton from the file downloaded fromhttps://ourairports.com/data/created by David MegginsonRows: 1
Columns: 7
$ ICAO_Code <chr> "RJTT"
$ IATA_Code <chr> "HND"
$ Airport_Name <chr> "Tokyo Haneda International Airport"
$ Longitude <dbl> 139.78
$ Latitude <dbl> 35.5523
$ Elevation <dbl> 10.668
$ Source <chr> "http://ourairports.com/data/airports.csv"Decoding
historical_decoded <- metar_decode(historical)Getting airport informaiton from the file downloaded fromhttps://ourairports.com/data/created by David Megginsondplyr::glimpse(historical_decoded)Rows: 1,502
Columns: 28
$ Remark <chr> "Don't use for flight planning or navigation!", "D…
$ Airport_ICAO <chr> "RJTT", "RJTT", "RJTT", "RJTT", "RJTT", "RJTT", "R…
$ METAR_Date <chr> "2025-03-01 00:00:00", "2025-03-01 00:30:00", "202…
$ Day_of_Month <dbl> 1, 1, 1, 1, 1, 1, 1, 1, 1, 1, 1, 1, 1, 1, 1, 1, 1,…
$ Hour <chr> "00:00", "00:30", "01:00", "01:30", "02:00", "02:3…
$ Time_zone <chr> "Z", "Z", "Z", "Z", "Z", "Z", "Z", "Z", "Z", "Z", …
$ Wind_speed <dbl> 2.572223, 2.057779, 2.057779, 2.057779, 2.057779, …
$ Wind_speed_unit <chr> "m/s", "m/s", "m/s", "m/s", "m/s", "m/s", "m/s", "…
$ Gust <dbl> NA, NA, NA, NA, NA, NA, NA, NA, NA, NA, NA, NA, NA…
$ Gust_unit <chr> "m/s", "m/s", "m/s", "m/s", "m/s", "m/s", "m/s", "…
$ Wind_shear <chr> NA, NA, NA, NA, NA, NA, NA, NA, NA, NA, NA, NA, NA…
$ Wind_direction <chr> "100", "80", "80", "80", "80", "80", "90; variable…
$ Temperature <dbl> 11, 11, 11, 12, 12, 13, 12, 13, 14, 14, 19, 19, 19…
$ Dew_point <dbl> 3, 4, 4, 4, 5, 6, 6, 6, 7, 8, 5, 5, 6, 4, 7, 5, 6,…
$ Pressure <dbl> 1022, 1022, 1022, 1022, 1021, 1020, 1020, 1019, 10…
$ Pressure_unit <chr> "hPa", "hPa", "hPa", "hPa", "hPa", "hPa", "hPa", "…
$ Visibility <chr> "Ceiling And Visibility OK", "Ceiling And Visibili…
$ Visibility_unit <chr> "m", "m", "m", "m", "m", "m", "m", "m", "m", "m", …
$ Cloud_coverage <chr> "", "", "", "", "", "", "Few (1-2 oktas) at 3000; …
$ Weather_information <chr> "", "", "", "", "", "", "", "", "", "", "", "", ""…
$ Runway_visibility <chr> "", "", "", "", "", "", "", "", "", "", "", "", ""…
$ Airport_Name <chr> "Tokyo Haneda International Airport", "Tokyo Haned…
$ Airport_IATA <chr> "HND", "HND", "HND", "HND", "HND", "HND", "HND", "…
$ Longitude <dbl> 139.78, 139.78, 139.78, 139.78, 139.78, 139.78, 13…
$ Latitude <dbl> 35.5523, 35.5523, 35.5523, 35.5523, 35.5523, 35.55…
$ Elevation <dbl> 10.668, 10.668, 10.668, 10.668, 10.668, 10.668, 10…
$ Decode_Date <chr> "2025-03-30 20:36:12.549712", "2025-03-30 20:36:12…
$ Original_METAR <chr> "202503010000 METAR RJTT 010000Z 10005KT CAVOK 11/…Let’s extract daily temperatures from decoded Haneda Airport data.
daily_temp <- historical_decoded |>
  group_by(Day_of_Month) |>
  summarise(daily_temp_mean = round(mean(Temperature), 0),
            daily_temp_min = min(Temperature),
            daily_temp_max = max(Temperature))
gt::gt(daily_temp)| Day_of_Month | daily_temp_mean | daily_temp_min | daily_temp_max |
|---|---|---|---|
| 1 | 14 | 10 | 19 |
| 2 | 13 | 9 | 19 |
| 3 | 4 | 3 | 8 |
| 4 | 3 | 1 | 5 |
| 5 | 9 | 5 | 11 |
| 6 | 9 | 6 | 12 |
| 7 | 7 | 3 | 11 |
| 8 | 4 | 2 | 6 |
| 9 | 9 | 6 | 12 |
| 10 | 10 | 7 | 12 |
| 11 | 11 | 10 | 13 |
| 12 | 12 | 11 | 15 |
| 13 | 14 | 10 | 17 |
| 14 | 12 | 8 | 17 |
| 15 | 8 | 6 | 11 |
| 16 | 8 | 6 | 12 |
| 17 | 10 | 6 | 16 |
| 18 | 8 | 4 | 12 |
| 19 | 6 | 1 | 11 |
| 20 | 9 | 6 | 12 |
| 21 | 13 | 9 | 17 |
| 22 | 18 | 14 | 22 |
| 23 | 16 | 12 | 23 |
| 24 | 15 | 12 | 18 |
| 25 | 20 | 17 | 22 |
| 26 | 17 | 13 | 26 |
| 27 | 19 | 15 | 21 |
| 28 | 16 | 9 | 23 |
| 29 | 7 | 6 | 9 |
Now we can plot it
ggplot(daily_temp, aes(x = Day_of_Month, group = 1)) +
  geom_point(aes(y = daily_temp_mean), color = "grey") +
  geom_line(aes(y = daily_temp_mean), color = "red") +
  geom_line(aes(y = daily_temp_min), color = "red", linetype = "dotted") +
  geom_line(aes(y = daily_temp_max), color = "red", linetype = "dotted") +
  scale_x_continuous(breaks = c(1, 5, 10, 15, 20, 25, 30), limits = c(1, 31)) +
  scale_y_continuous(breaks = seq(0, 20, 5)) +
  labs(
    title = "Daily temperatures at Tokyo Haneda International Airport",
    subtitle = "Extracted from METAR reports at HND, from 2025-03-01 to 2025-03-29",
    x = "Day of March 2025",
    y = "Daily average, minimum and maximum temperature (°C)"
  ) +
  theme_minimal()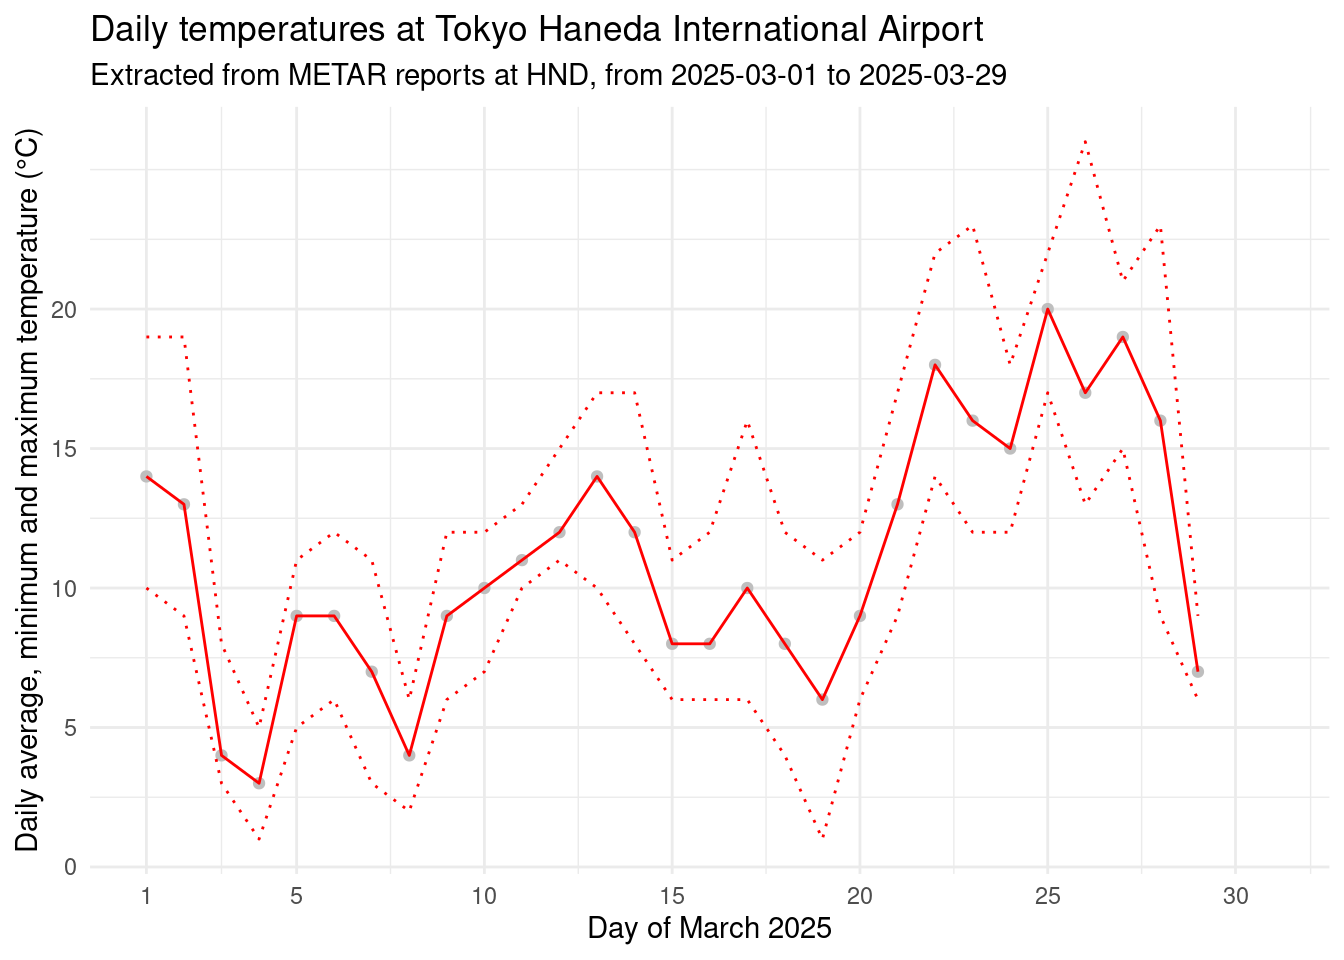
There are more possibilities to play with pmetar. I hope you will enjoy it!